Did Hongdae’s hip culture attract young people? Or did young people create ‘Hongdae style’?
The relationship between a commercial district and the concentration of consumers in a specific generation mostly is not by causal effect
Simultaneity oftern requires instrumental variables
Real cases also end up with mis-specification due to endogeneity
When working on data science-related projects, causality errors are common issues. There are quite a few cases where the variable thought to be the cause was actually the result, and conversely, the variable thought to be the result was the cause. In data science, this error is called ‘Simultaneity’. The first place where related research began was in econometrics, which is generally referred to as the three major data endogeneity errors along with loss of important data (Omitted Variable) and data inaccuracy (Measurement error).
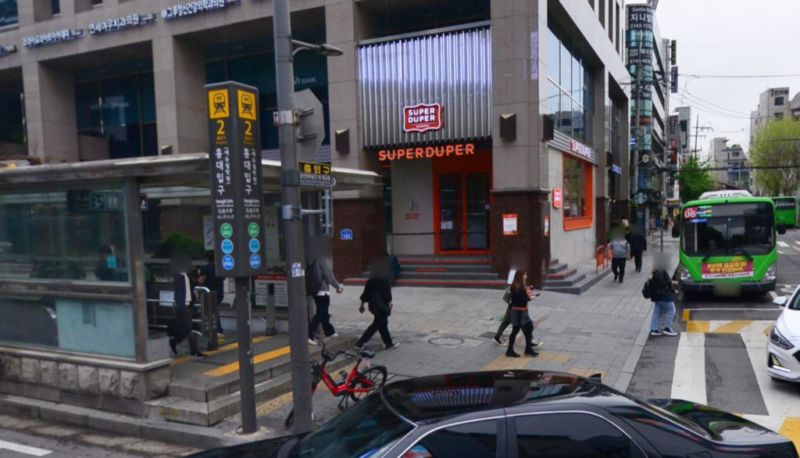
As a real-life example, let me bring in a SIAI’s MBA student’s thesis . Based on the judgment that the commercial area in front of Hongik University in Korea would have attracted young people in their 2030s, the student hypothesized that by finding the main variables that attract young people, it would be possible to find the variables that make up the commercial area where young people gather. If the student’s assumptions are reasonable, those who analyze commercial districts in the future will be able to easily borrow and use the model, and commercial district analysis can be used not only for those who want to open only small stores, but also for various areas such as promotional marketing of consumer goods companies, street marketing of credit card companies, etc.
Simultaneity error
However, unfortunately, it is not the commercial area in front of Hongdae that attracts young people in their 2030s, but a group of schools such as Hongik University and nearby Yonsei University, Ewha Womans University, and Sogang University that attract young people. In addition, the subway station one of the transportation hubs in Seoul. The commercial area in front of Hongdae, which was thought to be the cause, is actually the result, and young people in their 2030s, who were thought to be the result, may be the cause. In cases of such simultaneity, when using regression analysis or various non-linear regression models that have recently gained popularity (e.g. deep learning, tree models, etc.), it is likely that the simultaneity either exaggerates or under-estimates explanatory variables’ influence.
The field of econometrics has long introduced the concept of ‘instrumental variable’ to solve such cases. It can be one of the data pre-processing tasks that removes problematic parts regardless of any of the three major data internal error situations, including parts where causal relationships are complex. Since the field of data science was recently created, it has been borrowing various methodologies from surrounding disciplines, but since its starting point is the economics field, it is an unfamiliar methodology to engineering majors.
In particular, people whose way of thinking is organized through natural science methodologies such as mathematics and statistics that require perfect accuracy are often criticized as ‘fake variables’, but the data in our reality has various errors and correlations. As such, it is an unavoidable calculation in research using real data.
From data preprocessing to instrumental variables
Returning to the commercial district in front of Hongik University, I asked the student “Can you find a variable that is directly related to the simultaneous variable (Revelance condition) but has no significant relationship (Orthogonality condition) with the other variable among the complex causal relationship between the two? One can find variables that have an impact on the growth of the commercial district in front of Hongdae but have no direct effect on the gathering of young people, or variables that have a direct impact on the gathering of young people but are not directly related to the commercial district in front of Hongdae.
First of all, the existence of nearby universities plays a decisive role in attracting young people in their 2030s. The easiest way to find out whether the existence of these universities was more helpful to the population of young people, but is not directly related to the commercial area in front of Hongdae, is to look at the youth density by removing each school one by one. Unfortunately, it is difficult to separate them individually. Rather, a more reasonable choice of instrumental variable would be to consider how the Hongdae commercial district would have functioned during the COVID-19 period when the number of students visiting the school area while studying non-face-to-face has plummeted.
In addition, it is also a good idea to compare the areas in front of Hongik University and Sinchon Station (one station to east, which is another symbol of hipster town) to distinguish the characteristics of stores that are components of a commercial district, despite having commonalities such as transportation hubs and high student crowds. As the general perception is that the commercial area in front of Hongdae is a place full of unique stores that cannot be found anywhere else, the number of unique stores can be used as a variable to separate complex causal relationships.
How does the actual calculation work?
The most frustrating part from engineers so far has been the calculation methods that involve inserting all the variables and entering all the data with blind faith that ‘artificial intelligence’ will automatically find the answer. Among them, there is a method called ‘stepwise regression’, which is a calculation method that repeats inserting and subtracting various variables. Despite warnings from the statistical community that it should be used with caution, many engineers without proper statistics education are unable to use it. Too often I have seen this calculation method used haphazardly and without thinking.
As pointed out above, when linear or non-linear series regression analysis is calculated without eliminating the ‘error of simultaneity’, which contains complex causal relationships, events in which the effects of variables are over/understated are bound to occur. In this case, data preprocessing must first be performed.
Data preprocessing using instrumental variables is called ‘2-Stage Least Square (2SLS)’ in the data science field. In the first step, complex causal relationships are removed and organized into simple causal relationships, and then in the second step, the general linear or non-linear regression analysis we know is performed.
In the first stage of removal, regression analysis is performed on variables used as explanatory variables using one or several instrumental variables selected above. Returning to the example of the commercial district in front of Hongik University above, young people are the explanatory variables we want to use, and variables related to nearby universities, which are likely to be related to young people but are not expected to be directly related to the commercial district in front of Hongik University, are used. will be. If you perform a regression analysis by dividing the relationship between the number of young people and universities before and after the COVID-19 pandemic period as 0 and 1, you can extract only the part of the young people that is explained by universities. If the variables extracted in this way are used, the relationship between the commercial area in front of Hongdae and young peoplecan be identified through a simple causal relationship rather than the complex causal relationship above.
Failure cases of actual companies in the field
Since there is no actual data, it is difficult to make a short-sighted opinion, but looking at the cases of ‘error of simultaneity’ that we have encountered so far, if all the data were simply inserted without 2SLS work and linear or non-linear regression analysis was calculated, the area in front of Hongdae is because there are many young people. A great deal of weight is placed on the simple conclusion that the commercial district has expanded, and other than for young people, monthly rent in nearby residential and commercial areas, the presence or absence of unique stores, accessibility near subway and bus stops, etc. will be found to be largely insignificant values. This is because the complex interaction between the two took away the explanatory power that should have been assigned to other variables.
There are cases where many engineering students who have not received proper education in Korea claim that it is a ‘conclusion found by artificial intelligence’ by relying on tree models and deep learning from the perspective of ‘step analysis’, which inserts multiple variables at intersections, but there is an explanation structure between variables. There is only a difference in whether it is linear or non-linear, and therefore the explanatory power of the variable is partially modified, but the conclusion is still the same.
The above case is actually perfectly consistent with the mistake made when a credit card company and a telecommunications company jointly analyzed the commercial district in the Mapo-gu area. An official who participated in the study used the expression, ‘Collecting young people is the answer,’ but then as expected, there was no understanding of the need to use ‘instrumental variables’. He simply thought data pre-processing as nothing more than dis-regarding missing data.
In fact, the elements that make up not only Hongdae but also major commercial districts in Seoul are very complex. The reason why young people gather is mostly because the complex components of the commercial district have created an attractive result that attracts people, but it is difficult to find the answer through simple ‘artificial intelligence calculations’ like the above. When trying to point out errors in the data analysis work currently being done in the market, I simply chose ‘error of simultaneity’, but it also included errors caused by missing important variables (Omitted Variable Bias) and inaccuracies in collected variable data (Attenuation bias by measurement error). It requires quite advanced modeling work that requires complex consideration of such factors.
We hope that students who are receiving incorrect machine learning, deep learning, and artificial intelligence education will learn the above concepts and be able to do rational and systematic modeling.